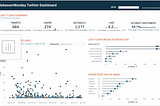
PinnedthejasmineinAnalytics VidhyaHow I built a Twitter dashboardFrom building an ETL pipeline to automatically update a dashboard.4 min read·Jan 3, 2021----
thejasmineHotel Performance Descriptive AnalysisUse Altryx to merge 1.2M transition data, analyze and share the interactive dashboard with Tableau.3 min read·Apr 12, 2021----
thejasmineinAnalytics VidhyaThink Tableau Level of Expression in SQL wayThree examples to demonstrate how I approach different business problems3 min read·Feb 17, 2021----
thejasmineDetermine sell price for secondhand luxury bagsAn end to end project from collecting data, creating data pipeline to a business intelligence web application.5 min read·Feb 15, 2021----
thejasmineinAnalytics VidhyaCohort Analysis with TableauIncrease revenue and decrease customer churn2 min read·Jan 31, 2021----
thejasmineinAnalytics VidhyaOnline Business Reporting with SQLFrom creating CSV import pipeline using python to analyze the data with PostgreSQL.6 min read·Dec 23, 2020--1--1
thejasmineinAnalytics VidhyaAB testing in Game — analyze using PtyAnalyze a mobile game AB testing result and provide recommendations.4 min read·Dec 20, 2020----
thejasmineData visualization using R | Customer Churn | Exploratory Data AnalysisFor me, data visualization means a picture that tells 1000 words. Data visualization is a powerful way to transform messy data into useful…6 min read·Dec 5, 2020----
thejasmineHow to import CSV file to pgAdminFor the demo, I am going to use olist dataset, a dataset of orders made at olist.com.2 min read·Nov 9, 2020----